

Reports is in beta. Expect it to change.
Build a view
Go to Reports, stay on the Views tab, and click Create View. Name it, optionally describe it, then click Add block.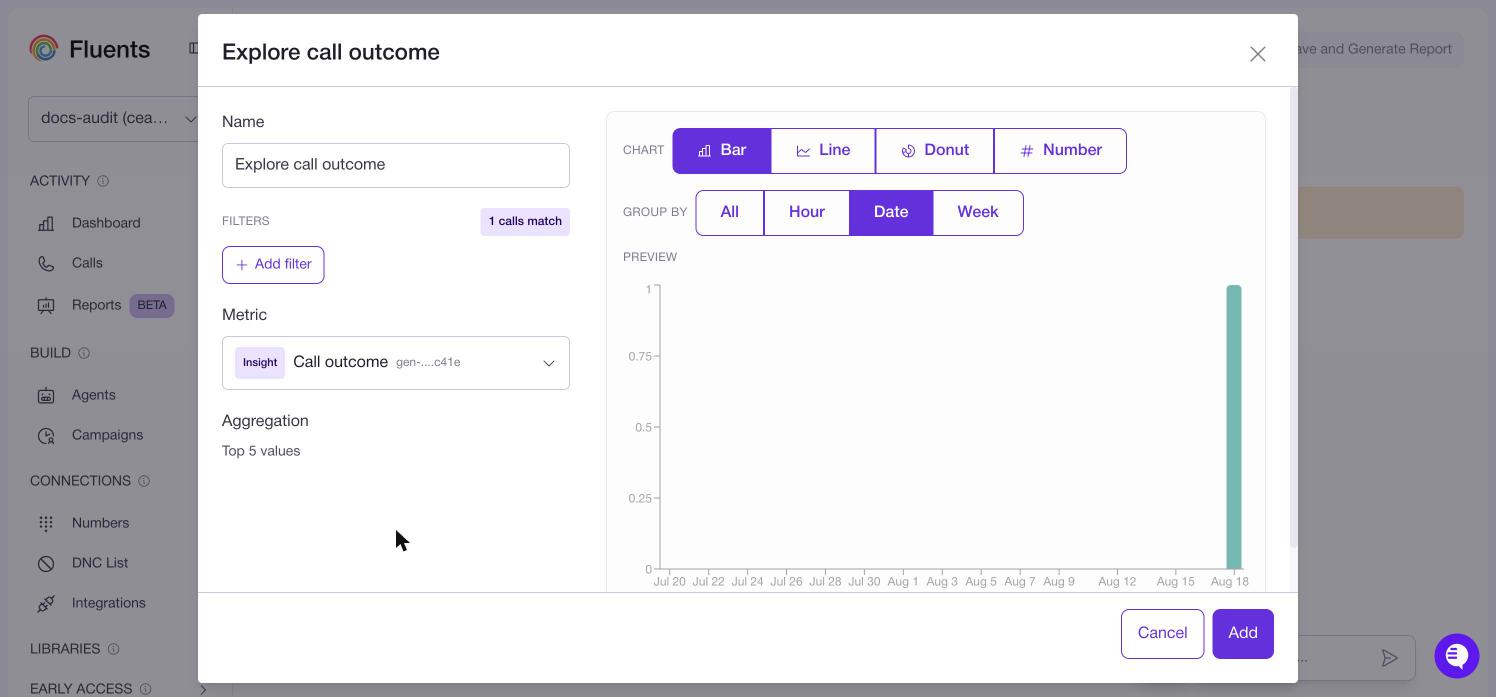
The preview updates as you go.
Aggregation behaves differently depending on the metric. For a yes/no or
categorical metric it is fixed and simply tells you what it is doing, such as counting
or taking the top five values. For a numeric metric you choose: Sum,
Average, Min or Max, defaulting to Average.
Add as many blocks as you want. A view holds several charts, and blocks can be
reordered, duplicated or removed.
The preview uses recent data, not your chosen date range. It is there to show
you the chart is wired up correctly. The numbers that count come from the generated
report.
Metrics
Metrics come from two places, and the list tags each one. Call fields are properties of the call itself. Direction, status, stage, result, duration, end reason, voicemail detection, do not call detected, recording available, and the latency figures for the speech, language and voice providers. Insights are the things your agents extract. Anything you set up under Post-call becomes available here.Generate the report
Click Save View first. On a brand new view, Generate Report stays disabled until it is saved. If you edit a saved view, the button becomes Save and Generate Report and does both. Then choose a Date range, which offers Last 7 days, Last 30 days, Last 90 days or a custom range, and generate. The result opens as a report, titled with the view name and the dates it covers, with each block showing its record count.Export saves the report as a PNG image, not as data. It is for pasting into a
deck or a message. If you need the underlying rows, export from
Calls instead.
Finding reports again
The Reports tab lists every report you have run.
Reports do not refresh. Each one is a snapshot. To get current numbers, generate a new
report from the same view.