> ## Documentation Index
> Fetch the complete documentation index at: https://docs.fluents.ai/llms.txt
> Use this file to discover all available pages before exploring further.
# Reports
> Build your own charts over call data and insights, then run them over a date range.
Reports is in **beta**. Expect it to change.
**Reports** lets you answer questions the Dashboard does not. You assemble a **view**
out of chart blocks, then run it over a date range to produce a **report**.
The split matters. A view is the question. A report is one answer, from one date
range, frozen at the moment you ran it.
***
## Build a view
Go to **Reports**, stay on the **Views** tab, and click **Create View**. Name it,
optionally describe it, then click **Add block**.
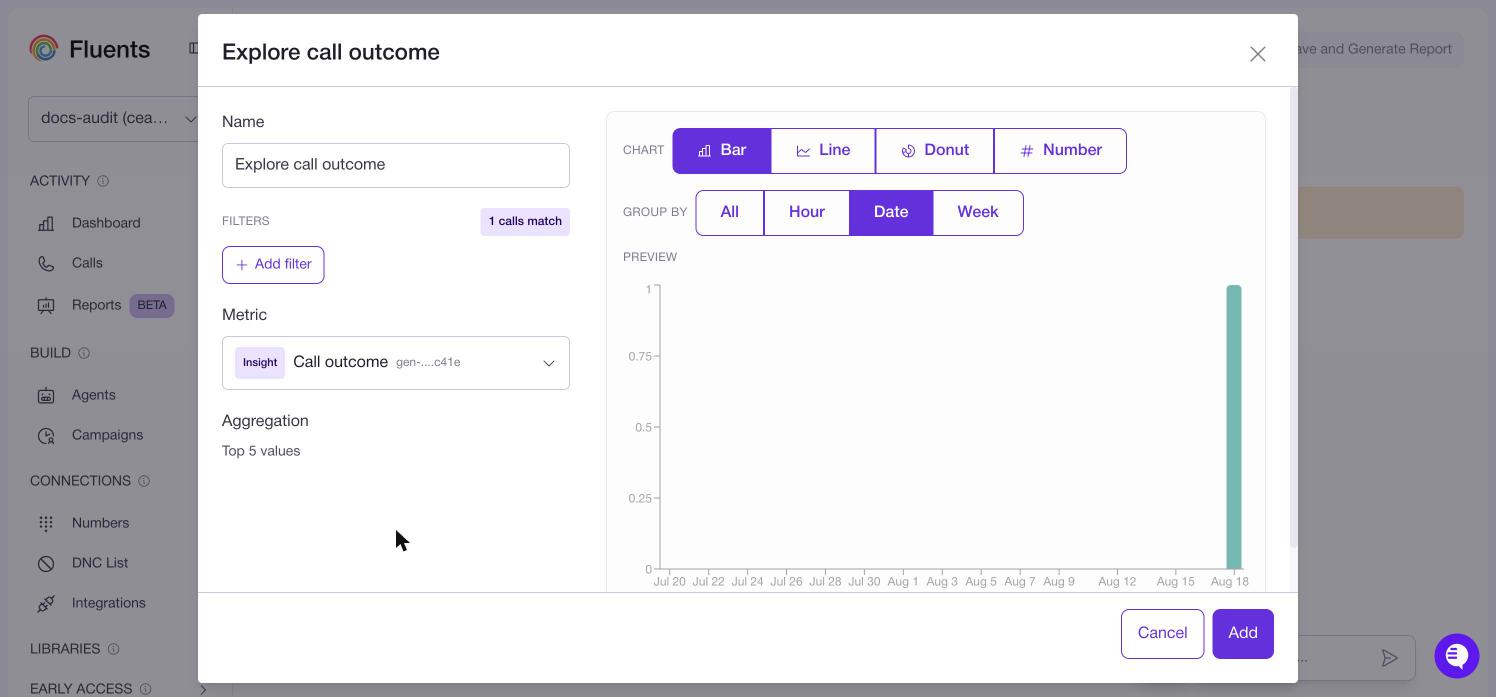 Each block is one chart.
| Setting | Options |
| --------------- | ----------------------------------------------------------------------- |
| **Name** | Fills itself in from the metric. Editable. |
| **Filters** | Which calls count. A live counter shows how many match as you add them. |
| **Metric** | What to measure. Either a **call field** or one of your **insights**. |
| **Aggregation** | How values are combined. See below. |
| **Chart** | Bar, Line, Donut or Number. Bar is the default. |
| **Group by** | All, Hour, Date or Week. Date is the default. |
The preview updates as you go.
**Aggregation** behaves differently depending on the metric. For a yes/no or
categorical metric it is fixed and simply tells you what it is doing, such as counting
or taking the top five values. For a **numeric** metric you choose: **Sum**,
**Average**, **Min** or **Max**, defaulting to Average.
Add as many blocks as you want. A view holds several charts, and blocks can be
reordered, duplicated or removed.
The preview uses **recent data**, not your chosen date range. It is there to show
you the chart is wired up correctly. The numbers that count come from the generated
report.
***
## Metrics
Metrics come from two places, and the list tags each one.
**Call fields** are properties of the call itself. Direction, status, stage, result,
duration, end reason, voicemail detection, do not call detected, recording available,
and the latency figures for the speech, language and voice providers.
**Insights** are the things your agents extract. Anything you set up under
**[Post-call](./post-call)** becomes available here.
Insights are what make this worth using. Charting call fields tells you how the
system behaved. Charting insights tells you what customers said, which is the
question you actually have.
***
## Generate the report
Click **Save View** first. On a brand new view, **Generate Report** stays disabled
until it is saved. If you edit a saved view, the button becomes **Save and Generate
Report** and does both.
Then choose a **Date range**, which offers Last 7 days, Last 30 days, Last 90 days or
a custom range, and generate.
The result opens as a report, titled with the view name and the dates it covers, with
each block showing its record count.
**Export** saves the report as a **PNG image**, not as data. It is for pasting into a
deck or a message. If you need the underlying rows, export from
**[Calls](./call)** instead.
***
## Finding reports again
The **Reports** tab lists every report you have run.
| Column | What it shows |
| -------------- | ------------------------- |
| **View** | The view it came from. |
| **Date range** | The period it covers. |
| **Status** | Whether the run finished. |
| **Run at** | When it ran. |
Reports do not refresh. Each one is a snapshot. To get current numbers, generate a new
report from the same view.
***
## Where to go next
* Headline numbers without building anything: **[Dashboard](./dashboard)**
* Create the insights worth charting: **[Post-call](./post-call)**
* The underlying calls: **[Calls](./call)**
Each block is one chart.
| Setting | Options |
| --------------- | ----------------------------------------------------------------------- |
| **Name** | Fills itself in from the metric. Editable. |
| **Filters** | Which calls count. A live counter shows how many match as you add them. |
| **Metric** | What to measure. Either a **call field** or one of your **insights**. |
| **Aggregation** | How values are combined. See below. |
| **Chart** | Bar, Line, Donut or Number. Bar is the default. |
| **Group by** | All, Hour, Date or Week. Date is the default. |
The preview updates as you go.
**Aggregation** behaves differently depending on the metric. For a yes/no or
categorical metric it is fixed and simply tells you what it is doing, such as counting
or taking the top five values. For a **numeric** metric you choose: **Sum**,
**Average**, **Min** or **Max**, defaulting to Average.
Add as many blocks as you want. A view holds several charts, and blocks can be
reordered, duplicated or removed.
The preview uses **recent data**, not your chosen date range. It is there to show
you the chart is wired up correctly. The numbers that count come from the generated
report.
***
## Metrics
Metrics come from two places, and the list tags each one.
**Call fields** are properties of the call itself. Direction, status, stage, result,
duration, end reason, voicemail detection, do not call detected, recording available,
and the latency figures for the speech, language and voice providers.
**Insights** are the things your agents extract. Anything you set up under
**[Post-call](./post-call)** becomes available here.
Insights are what make this worth using. Charting call fields tells you how the
system behaved. Charting insights tells you what customers said, which is the
question you actually have.
***
## Generate the report
Click **Save View** first. On a brand new view, **Generate Report** stays disabled
until it is saved. If you edit a saved view, the button becomes **Save and Generate
Report** and does both.
Then choose a **Date range**, which offers Last 7 days, Last 30 days, Last 90 days or
a custom range, and generate.
The result opens as a report, titled with the view name and the dates it covers, with
each block showing its record count.
**Export** saves the report as a **PNG image**, not as data. It is for pasting into a
deck or a message. If you need the underlying rows, export from
**[Calls](./call)** instead.
***
## Finding reports again
The **Reports** tab lists every report you have run.
| Column | What it shows |
| -------------- | ------------------------- |
| **View** | The view it came from. |
| **Date range** | The period it covers. |
| **Status** | Whether the run finished. |
| **Run at** | When it ran. |
Reports do not refresh. Each one is a snapshot. To get current numbers, generate a new
report from the same view.
***
## Where to go next
* Headline numbers without building anything: **[Dashboard](./dashboard)**
* Create the insights worth charting: **[Post-call](./post-call)**
* The underlying calls: **[Calls](./call)**